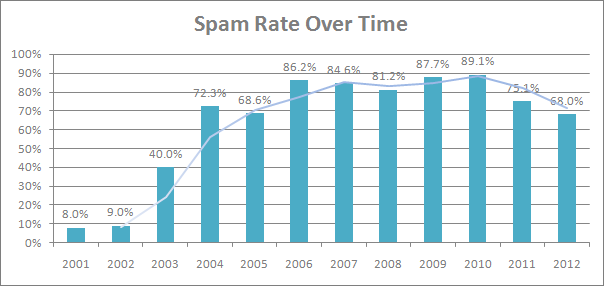
In a matter of just the past 10 years, email spam has become a multimillion industry. Despite a significant drop in email spam in 2011 (dropping to an average of 75.1% of all email in 2011 compared with 89.1% in the year of 2010), spam continues to be a serious problem for many companies and individual email users.
Email Spam Rate: Fluctuations Over Time
According to a Symantec Intelligence Report issued in February 2012, global spam levels continued to fall, as it now accounts for 68% of global email traffic. If we compare these figures to the data from the previous years’ reports, we’ll see that the email spam rate has been continuously decreasing within the last three years:

Back in 2001, about 8% of all mail was identified as spam. In 2002 this figure was 9% or 1 in 11.During 2003, MessageLabs Anti-Spam service identified 40% of emails scanned as spam.
The overall spam trend for the first half of 2005 saw a leveling of spam in line with the 2004 yearly figure of 72.3%, with an annual average percentage of 68.6% emails being identified as spam.
One of the key developments in 2006 was a significant increase in spam activity, with levels reaching 86.2%, the highest experienced since 2001.
2007 was the year when botnets came of age. The overall spam trend for 2007 was around 84.6%. Total spam levels averaged 81.2% for the year 2008.
But in 2009 the annual average spam rate was 87.7%, an increase of 6.5 percent on the 2008 statistic. In 2010, the average global spam rate for the year was 89.1%, an increase of 1.4% compared with 2009.
In 2011 the spam rate dropped to an average of 75.1% of all email. The dramatic decline, beginning December 25, 2010 and continuing through January 1, 2011, was the result of both a halt in the spam-sending activities of three botnets – Rustock, Lethic and Xarvester – as well as unrest among pharmaceutical spam-sending gangs.
In the current year of 2012, spam levels have continued to decrease, reaching 68% of all mail in February 2012. Of course things might change by the end of the year and show a totally different picture. However we’ve been observing a descending trend within the last three years so far.
Most Spammed Countries
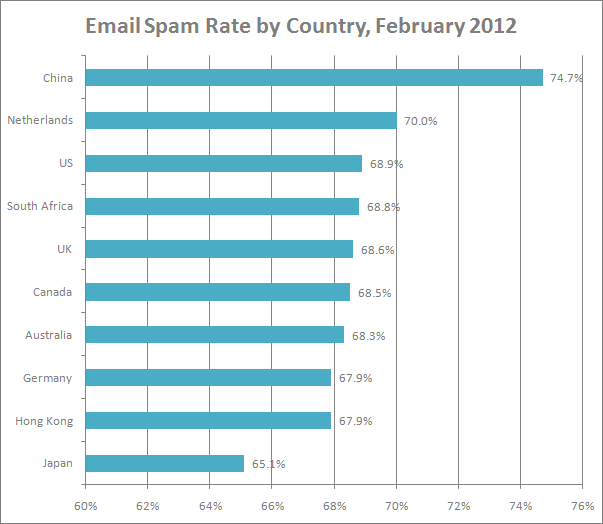
In February 2012, the highest volume of spam was detected in the electronic mail of Chinese users: 74.7% of all mail. Residents of The Netherlands found a 70% rate of spam messages among their mail. In the US, 68.9% of email was spam; South Africa accounted for 68.8% of spam. UK email users faced 68.6% of spam. Canada and Australia reported slightly lower figures: 68.5% and 68.3% respectively. 67.9% of spam was reported by Hong Kong users as well as users from Germany; Japanese users experienced 65.1% of spam in their mail.

Top Spam Categories
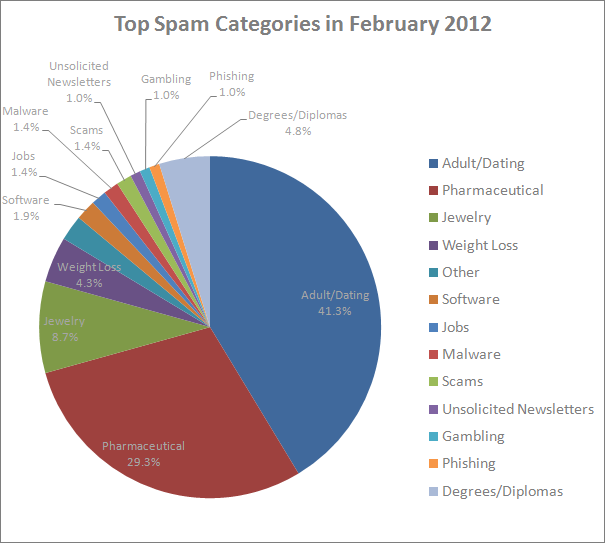
According to a Symantec Intelligence Report issued in February 2012, the most common category of spam was related to the Adult/Dating category, overtaking pharmaceutical related spam for the first time:

There were particular grounds accounting for the shift in email spam categories. Between 2010 and 2011, pharmaceutical spam fell by 34%, in large part owing to the demise of the Rustock botnet, which was mainly used to pump-out pharmaceutical spam. In contrast, messages about watches and jewelry, as well as sex and dating, both increased as a percentage.
